Visokio · Data applications
Turning an analysis into an application people can use.
A dashboard may be the right result. In other cases the user needs to upload a file, investigate a problem, make a controlled change, run a model, produce an answer or trigger a process. That is where the analytical project starts behaving like an application.
From general platform to focused experience
Omniscope gives the builder a broad environment for working with data, but the person using the finished application may need only a file upload, a few controls and the result. The Data Quality Inspector is a small example: drop in a CSV or Excel file and the application runs the Omniscope workflow, profiles the data and returns a focused report on missing values, duplicates and outliers.
In a recent internal prototype for a customer-success application, the boundary was different. SQLite held customers, deals, renewals and activities as the transactional system of record, while Omniscope handled the visible application, preparation, validation, editing and reporting. The useful interface came from combining the two deliberately, not from pretending one component should do every job.
Application patterns
Four common ways this pattern is used.
Operational applications
Give teams a controlled interface for data preparation, review, planning, quality checks or recurring decisions.
Branded analytics
Deliver a product-specific portal or report that carries the organisation’s identity, tested calculations and permissions.
Analytics inside SaaS
Add interactive exploration, reports and data-driven features to an existing product without rebuilding an analytics engine.
Workflow as an API
Let another system execute a parameterised workflow and receive a versioned result through the Omniscope API.
A physical example
The AirGradient project starts with a real sensor.
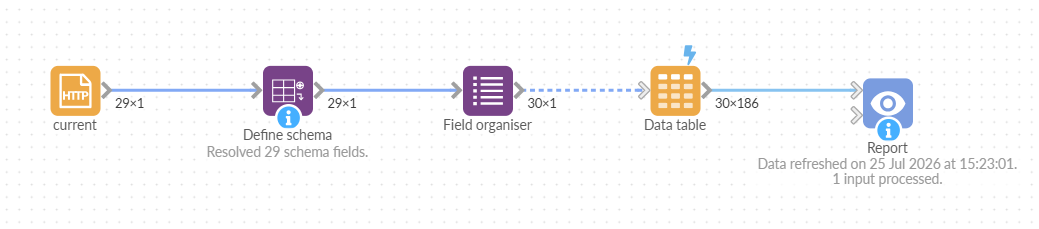
The customised monitor calls an Omniscope workflow directly. Measurements are stored and analysed, the interactive report is updated, and the same project can apply threshold logic and produce a public alert. I deliberately removed the middleware service, home server and inbound router port from this version.
Low-code where useful, code where necessary
Visual workflows let domain experts assemble much of the application directly. Python, R and JavaScript can extend the platform for specialist calculations, libraries or interfaces. Custom blocks can package reusable behaviour. APIs connect the result to the surrounding system.
I have never found the no-code-versus-code purity debate very useful. Can the team still open it, test it, deploy it and know who owns it? Visual blocks are excellent for common work; specialist code earns its place when it makes a method or interaction clearer rather than hiding it.
Embedded analytics should become part of the product
When analytics is part of what a software company sells, sending customers to a generic BI interface can feel like leaving the product halfway through. The data exploration should understand the product’s domain, permissions and brand. Omniscope can provide that analytical layer while the host product keeps its own application and commercial identity.