Air quality · Citizen science
Making air-quality data more accessible, from public records to open sensors.
This is the work I have been doing around Taranto since 2019: turning public monitoring data into reports and alerts people can inspect, and now connecting an open sensor directly to my own Omniscope workflow.
I publish the first Omniscope air-quality report
I published an automatically updated Omniscope report using ARPA Puglia measurements. In the accompanying post, I invited people in Taranto to explore the data with me and build something useful from it. Read the original public Facebook post ↗
I add history, comparisons and an Italian version
I extended the history back to 2016, added new comparison views and published an Italian version for people in Taranto and the surrounding province. See the historical comparison update ↗ See the Italian release ↗
I begin publishing alerts for high readings
I began publishing alerts when the monitoring data showed high pollution measurements. The posts record the highest benzene value then measured by the ARPA stations, followed by 14 more peaks around Via Orsini in two months. See the November record ↗ See the two-month alert record ↗
I document pollution events and gaps in monitoring
I documented repeated sulphur-dioxide exceedances, a severe combination of pollutants, a failed Tamburi monitoring station and another benzene record. The posts asked public bodies to investigate the events and also showed when monitoring data was missing. See the SO₂ warning ↗ See the request concerning missing monitoring ↗ See the December benzene record ↗
The Omniscope alerts reach PeaceLink in Taranto
I put extraction, analysis, reporting, screenshot generation and threshold alerts into one Omniscope workflow. Alessandro Marescotti describes receiving my benzene graphs from London and relaying the warnings through PeaceLink’s network in Taranto. Read Marescotti’s account ↗ Read the implementation tutorial ↗ Read the full PeaceLink account in Italian ↗
PeaceLink presents the benzene analysis to the Senate
Working with PeaceLink, I analysed more than 80,000 hourly benzene measurements. Alessandro Marescotti presented the results during an Italian Senate hearing on ILVA, and the official slides credit my data analysis and processing with Omniscope. See my public record of the presentation ↗ Open the official Senate slides ↗
I compare peaks, wind, neighbourhoods and production
I compared hourly peaks with wind direction, PM10 in Tamburi and Talsano across 2017–2025, and the reduction in benzene alongside falling steel production. The relationships deserve investigation, but the monitoring data alone does not prove one cause. See the wind-direction analysis ↗ See the long-term PM10 comparison ↗ See the benzene and production analysis ↗
I move the alerts to Facebook and customise an open sensor
I moved the current hourly benzene alerts to Aria Taranto, with each alert linking back to the live Omniscope reports. The earlier OmniscopeBot account on X remains the historical alert archive. In parallel, I customised an open AirGradient monitor to send measurements directly and privately to an Omniscope workflow, with no vendor cloud, middleware, home server or inbound router port.
Live public resources
Open an alert, then check the report.
Facebook carries the current alerts. Each post links to an Omniscope report where anyone can inspect the measurements, context and history behind it.
Aria Taranto
Current public alerts generated from the Omniscope workflow, focused on hourly benzene measurements around Taranto.
OmniscopeBot archive
The earlier automated alert channel, preserving the history before publication moved to Facebook.
Aria Taranto report
Explore the current measurements and the analytical context linked from the Facebook alerts.
Benzene report
Investigate benzene measurements, peaks and longer-term patterns through the public interactive report.
How the alert is made
How Omniscope turns a qualifying measurement into an alert.
Omniscope refreshes the public data, applies the threshold rule, saves a screenshot and publishes an alert with a link back to the interactive report.
Public measurements → Omniscope workflow → historical report → threshold rule → screenshot and alert → linked report and source data
The 2023–2025 record
The first visible reversal since monitoring began.
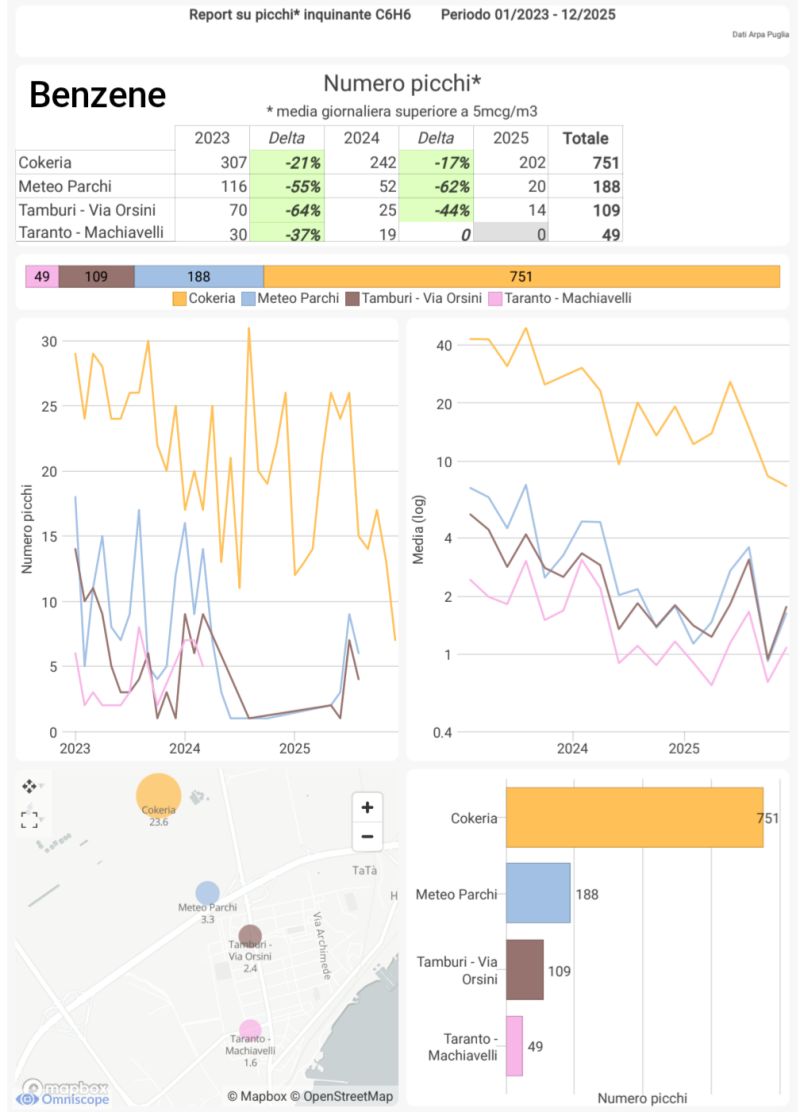
In the available 2023–2025 data, I counted fewer daily benzene peaks and lower average values, particularly around Tamburi. Steel production and emissions from the former ILVA site also fell during the period. I treated that coincidence as something to examine, not proof of one cause; the 2025 period was incomplete when I published the comparison.
Analytical discipline
A relationship in the data is not automatically an explanation.
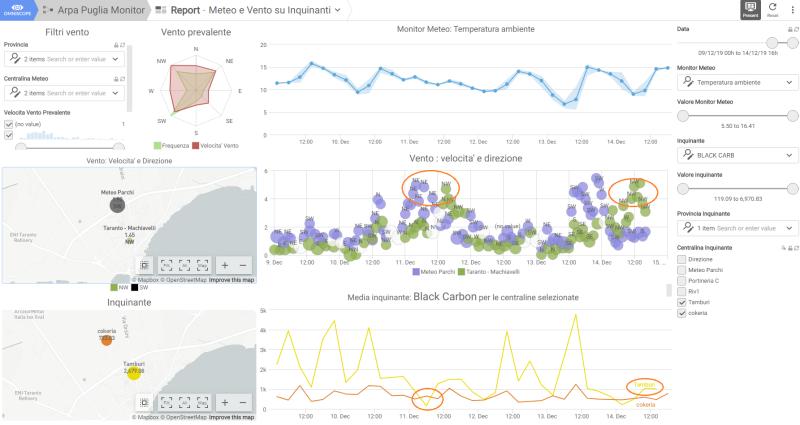
I found lower black-carbon readings when stronger winds blew from the north. That could mean pollution was being dispersed, but it could also reflect unreliable measurements under those conditions or another factor. The report lets readers inspect the pattern; it cannot turn correlation into proof.
Read the story
The articles behind this air-quality work.
The English series covers the open monitor, the 80,000 hourly readings, public ARPA data, evidence-preserving alerts and the complete monitoring path. The article in Italian brings together the work done with PeaceLink over time.
How to Build a Private AirGradient-to-Analytics Pipeline
Build a private AirGradient analytics pipeline using custom ESP32-C3 firmware, local Android control and direct HTTPS ingestion into Omniscope.
02What I Learned from Analysing 80,000 Hourly Benzene Measurements
Lessons from analysing more than 80,000 hourly benzene readings in Taranto: preserve peaks, define thresholds, expose gaps and version the evidence.
03Making Institutional Air-Quality Data Usable by Citizens
How ARPA Puglia monitoring files became a public, Italian-language Omniscope instrument for citizens, classrooms, comparisons and civic investigation.
04Designing Alerts That Preserve the Evidence Behind the Claim
Design data-driven air-quality alerts with station, time, units, averaging period, reference meaning, source status and links to inspectable evidence.
05Open Hardware, Private Infrastructure and Citizen-Owned Monitoring
What citizen-owned air-quality monitoring requires across open hardware, firmware, local control, private transport, stored history and responsible interpretation.
ITIl lavoro con PeaceLink sui dati ambientali di Taranto
Come il lavoro sui dati ambientali di Taranto è diventato un supporto continuativo alle attività civiche e istituzionali di PeaceLink.
Public record
Where the work was used.
Environmental data in the classroom
Alessandro Marescotti documents students using the Omniscope dashboard to compare ARPA monitoring data and describes it as environmental data democratisation.
Analysis presented to the Italian Senate
PeaceLink’s official hearing slides credit Antonio for data analysis and processing with Omniscope, and acknowledge Annamaria Moschetti among the collaborators.
Eleven years of benzene measurements
The public data available for the February 2024 analysis contained 63 readings over 27 µg/m³, including 32 in 2023. ARPA’s final report used a more complete 2023 series and recorded 47.
Monitoring from below
PeaceLink’s account of the dashboard, public alerts and how people used the published monitoring data.
A continuing public record
I have documented this work through public posts and alerts, work with Alessandro Marescotti, PeaceLink and people in Taranto and Tamburi, and exchanges with scientists and doctors including Annamaria Moschetti. The linked posts include the first report, public warnings, requests for institutional action, later comparisons and the Senate hearing where Alessandro presented analysis produced in Omniscope.
Open implementation
I published the modified firmware, browser installer and Android controller so other people can inspect the code, adapt it and connect an open monitor to their own private analysis.